Tour: Extended Reports
The Case Study page demonstrated a basic Report, but Reports can be elaborated.
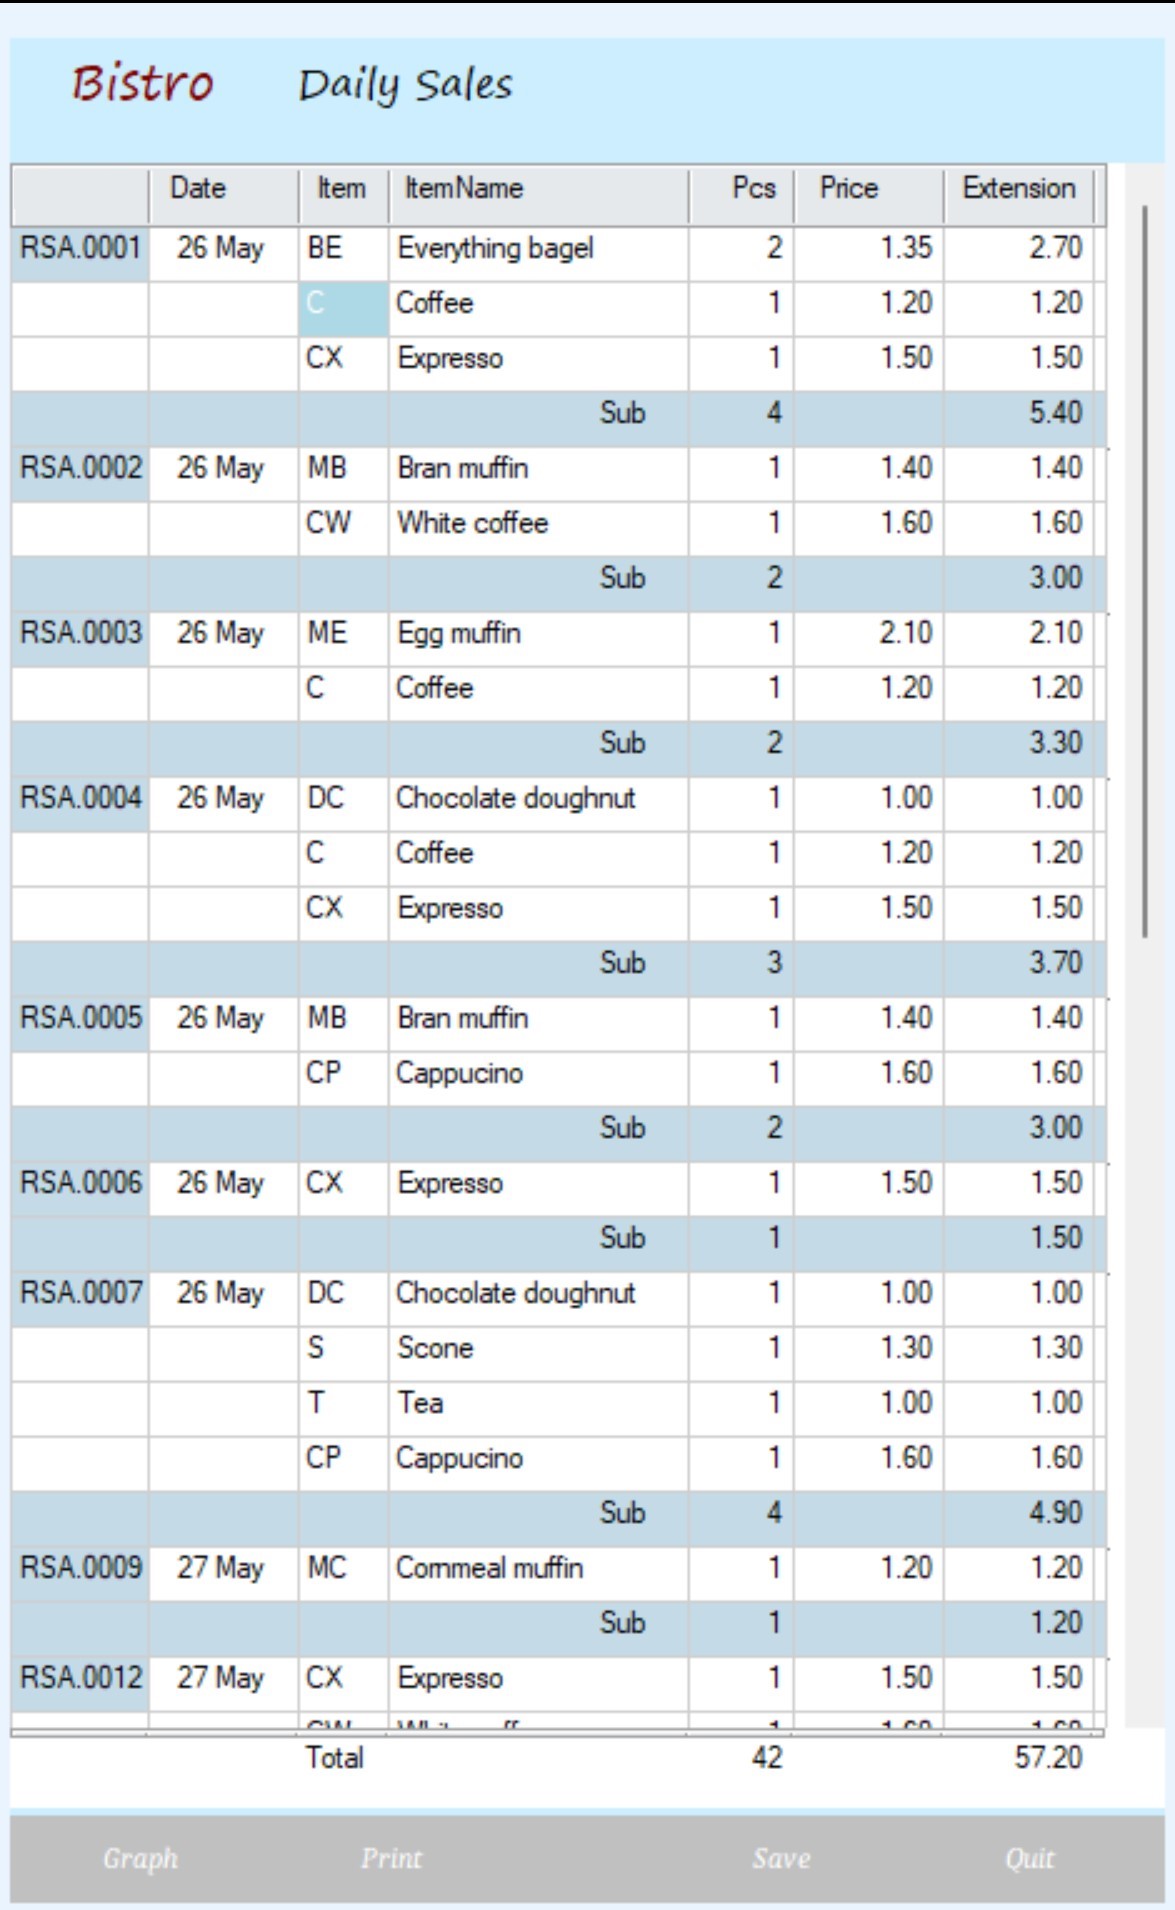
Returning to the simple Cafe Daily Sales Report...
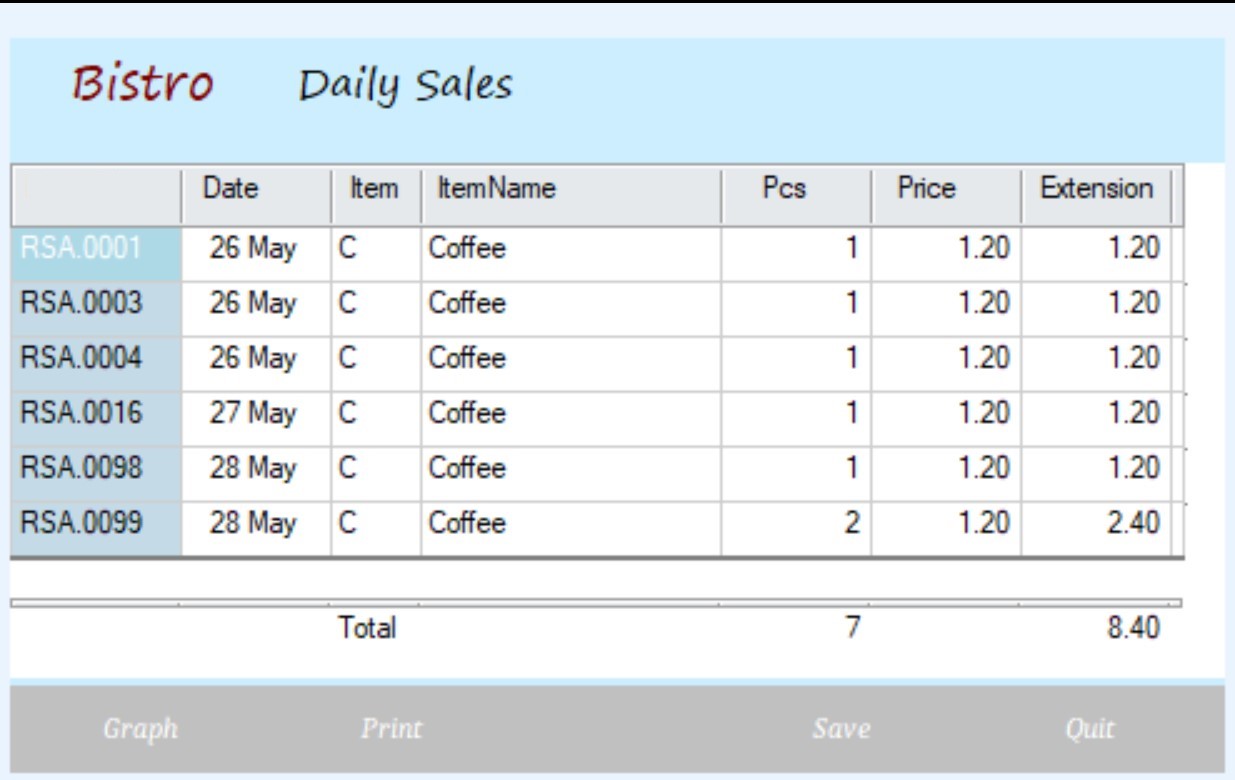
Ctrl-click on any cell or combination of cells sets up 'and/or' filters.
With Ctrl-click we can view just sales of Coffee.
More complex or permanent report filters can be set up with the parameters window.
Using the Sales Report above as a starting point, create formula columns using 'if/then' conditions, set filters, hide intermediate columns—all as in spreadsheets.
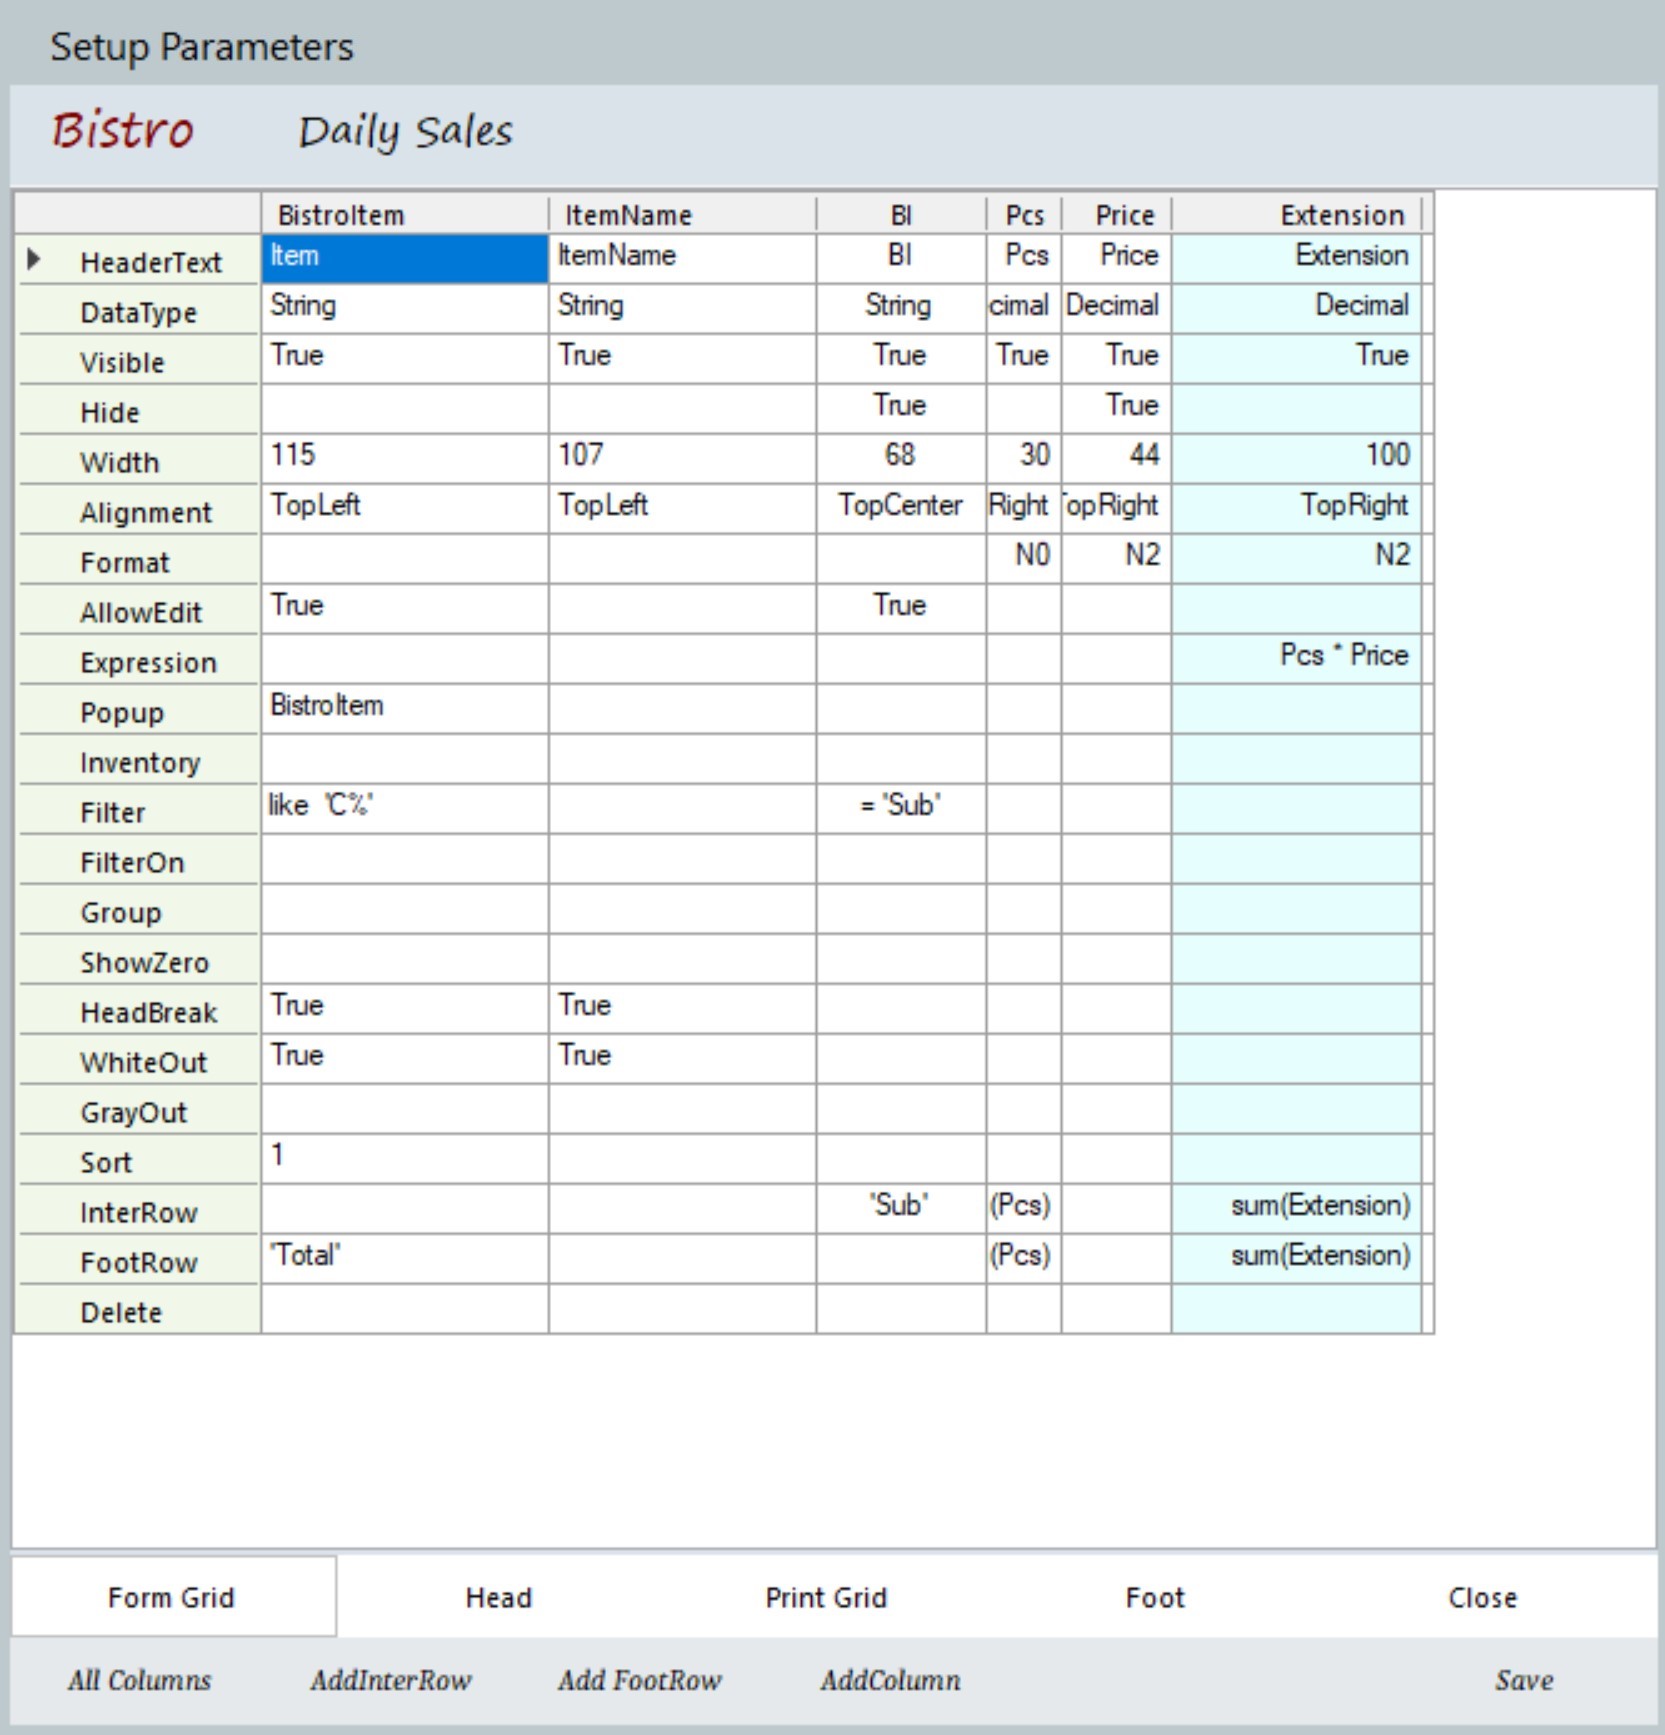
Here, sorting on Item, the two filters sort out just the Coffee drinks and present their SubTotals.
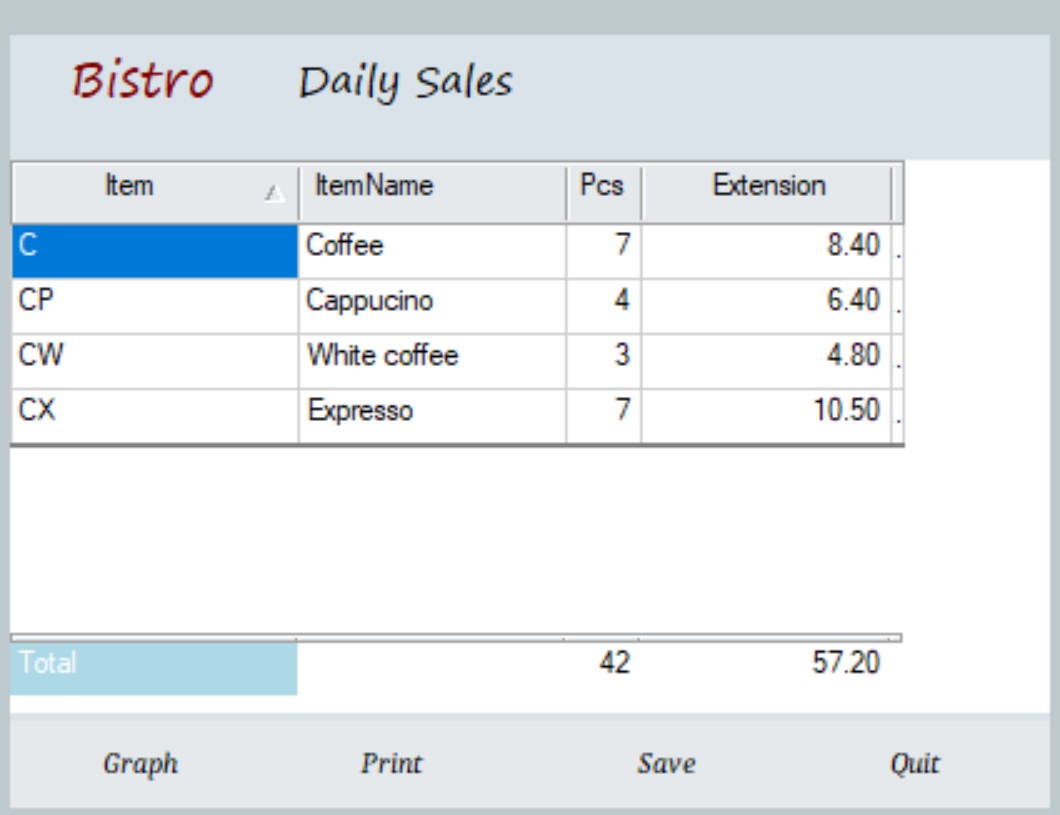
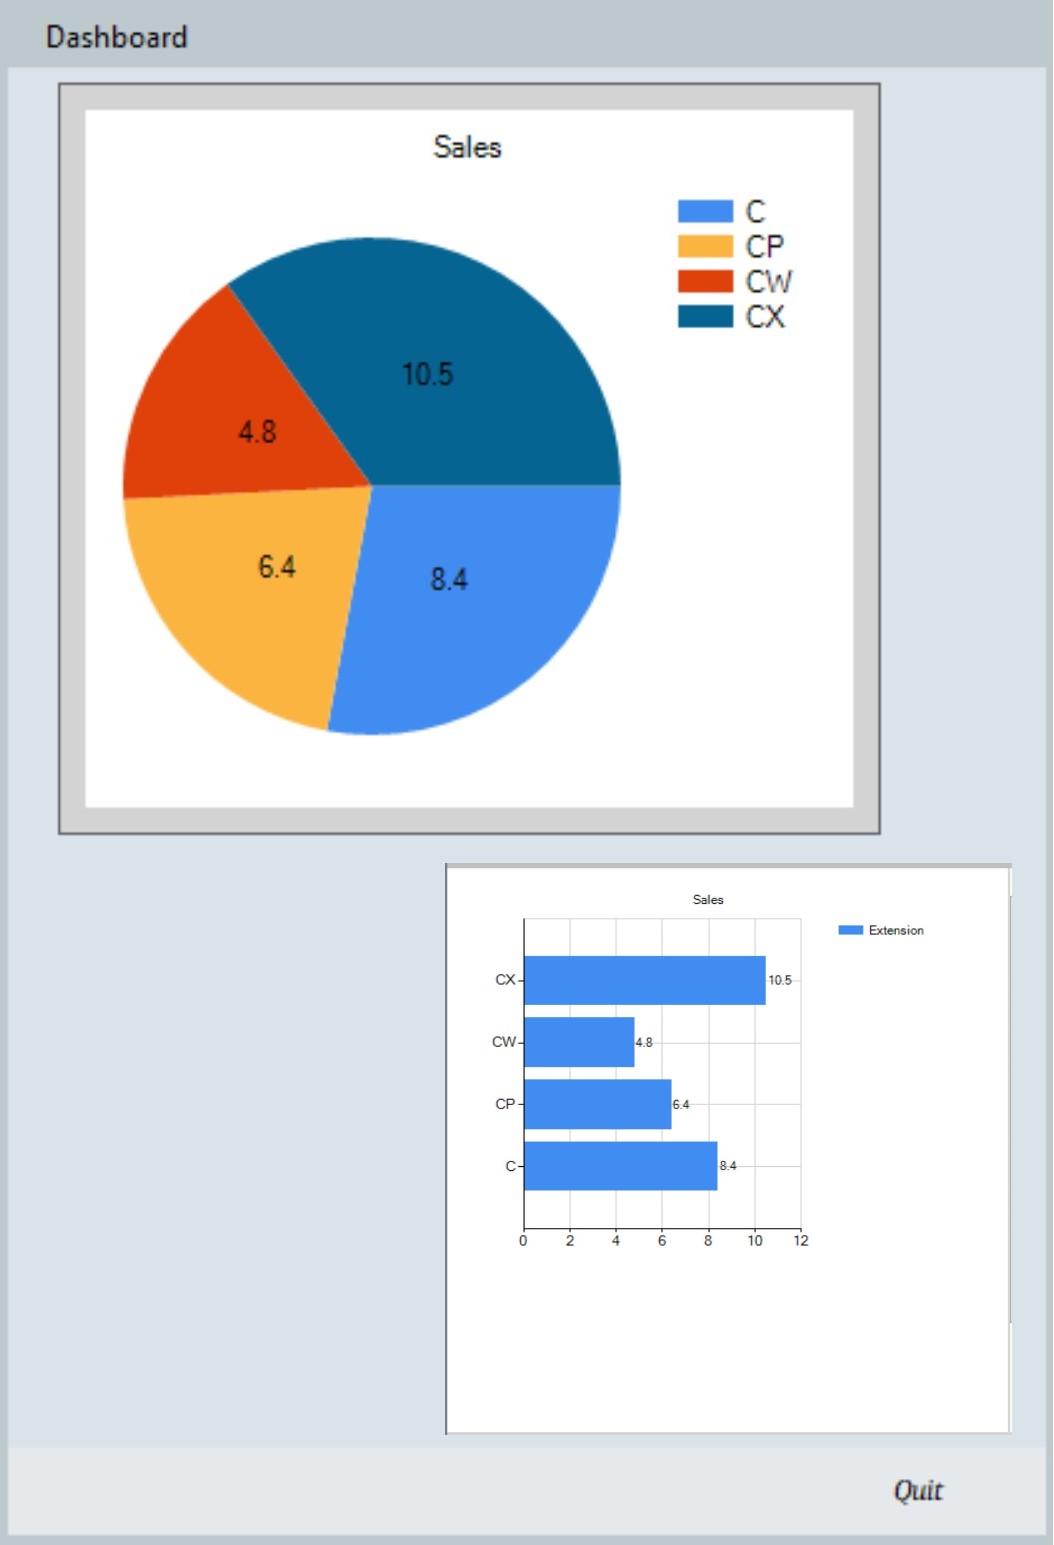
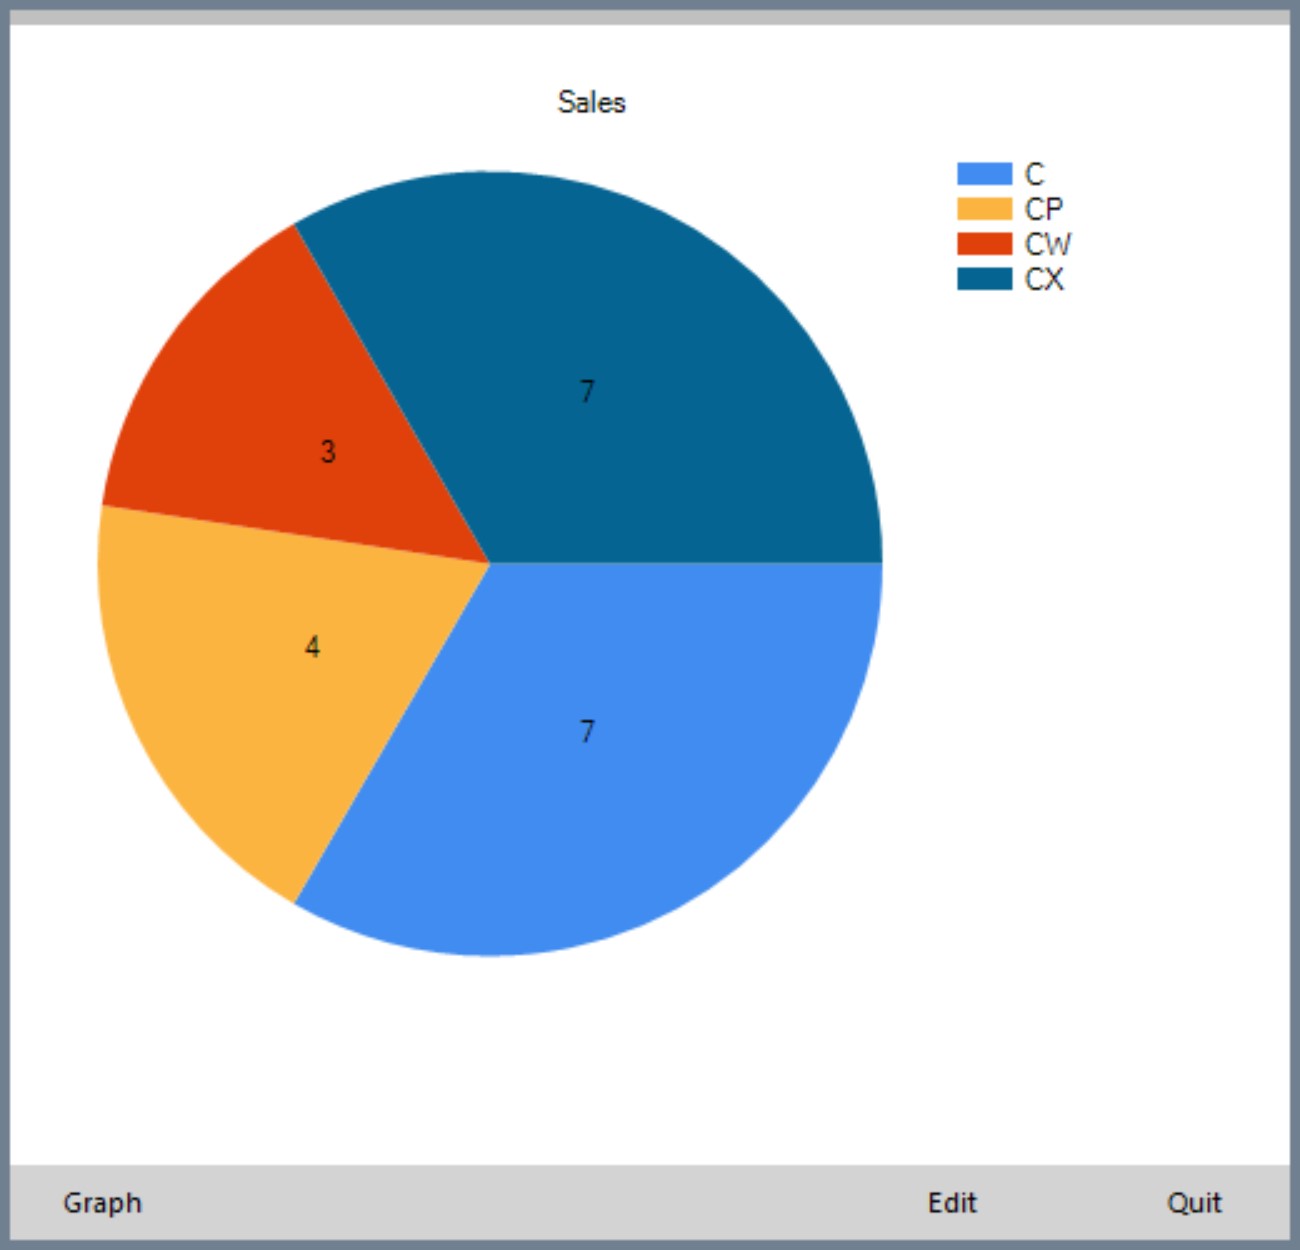
We can view the results as a graph.
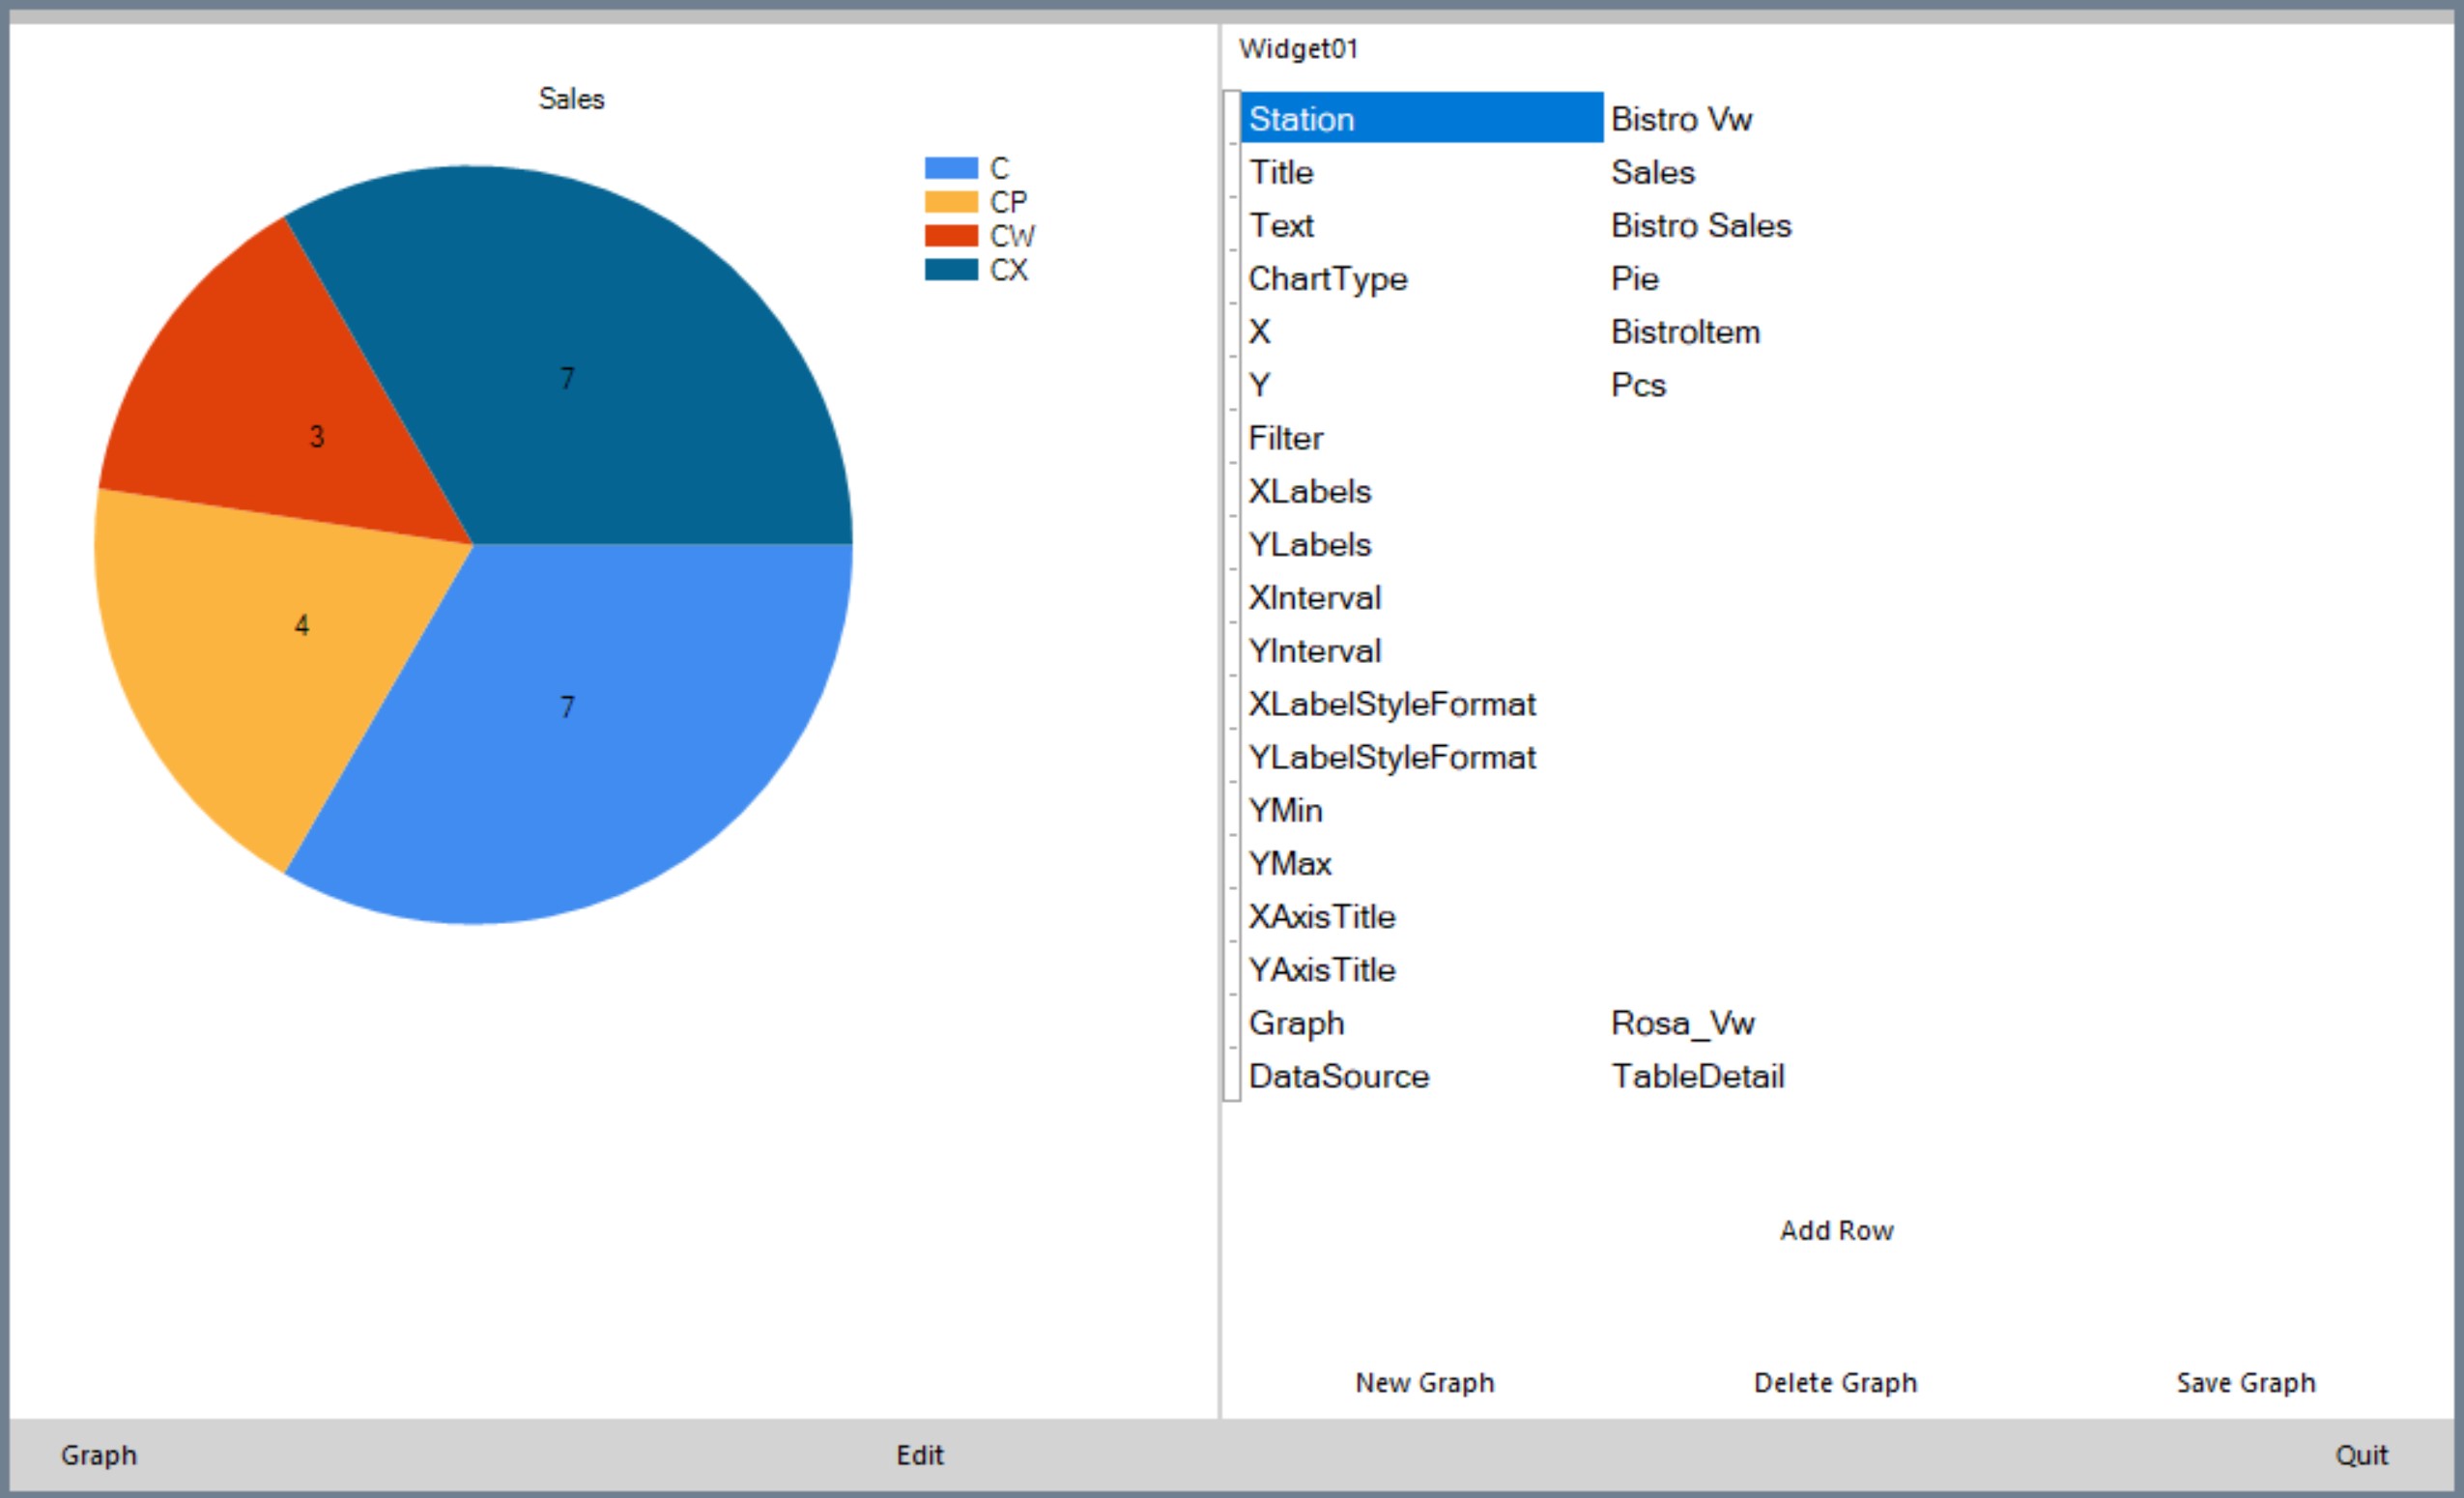
The Edit button opens a panel to edit the graph. Some basic graph parameters are listed. They are the same as used in Excel and many other programs, and more can be added with the 'Add Row' button.
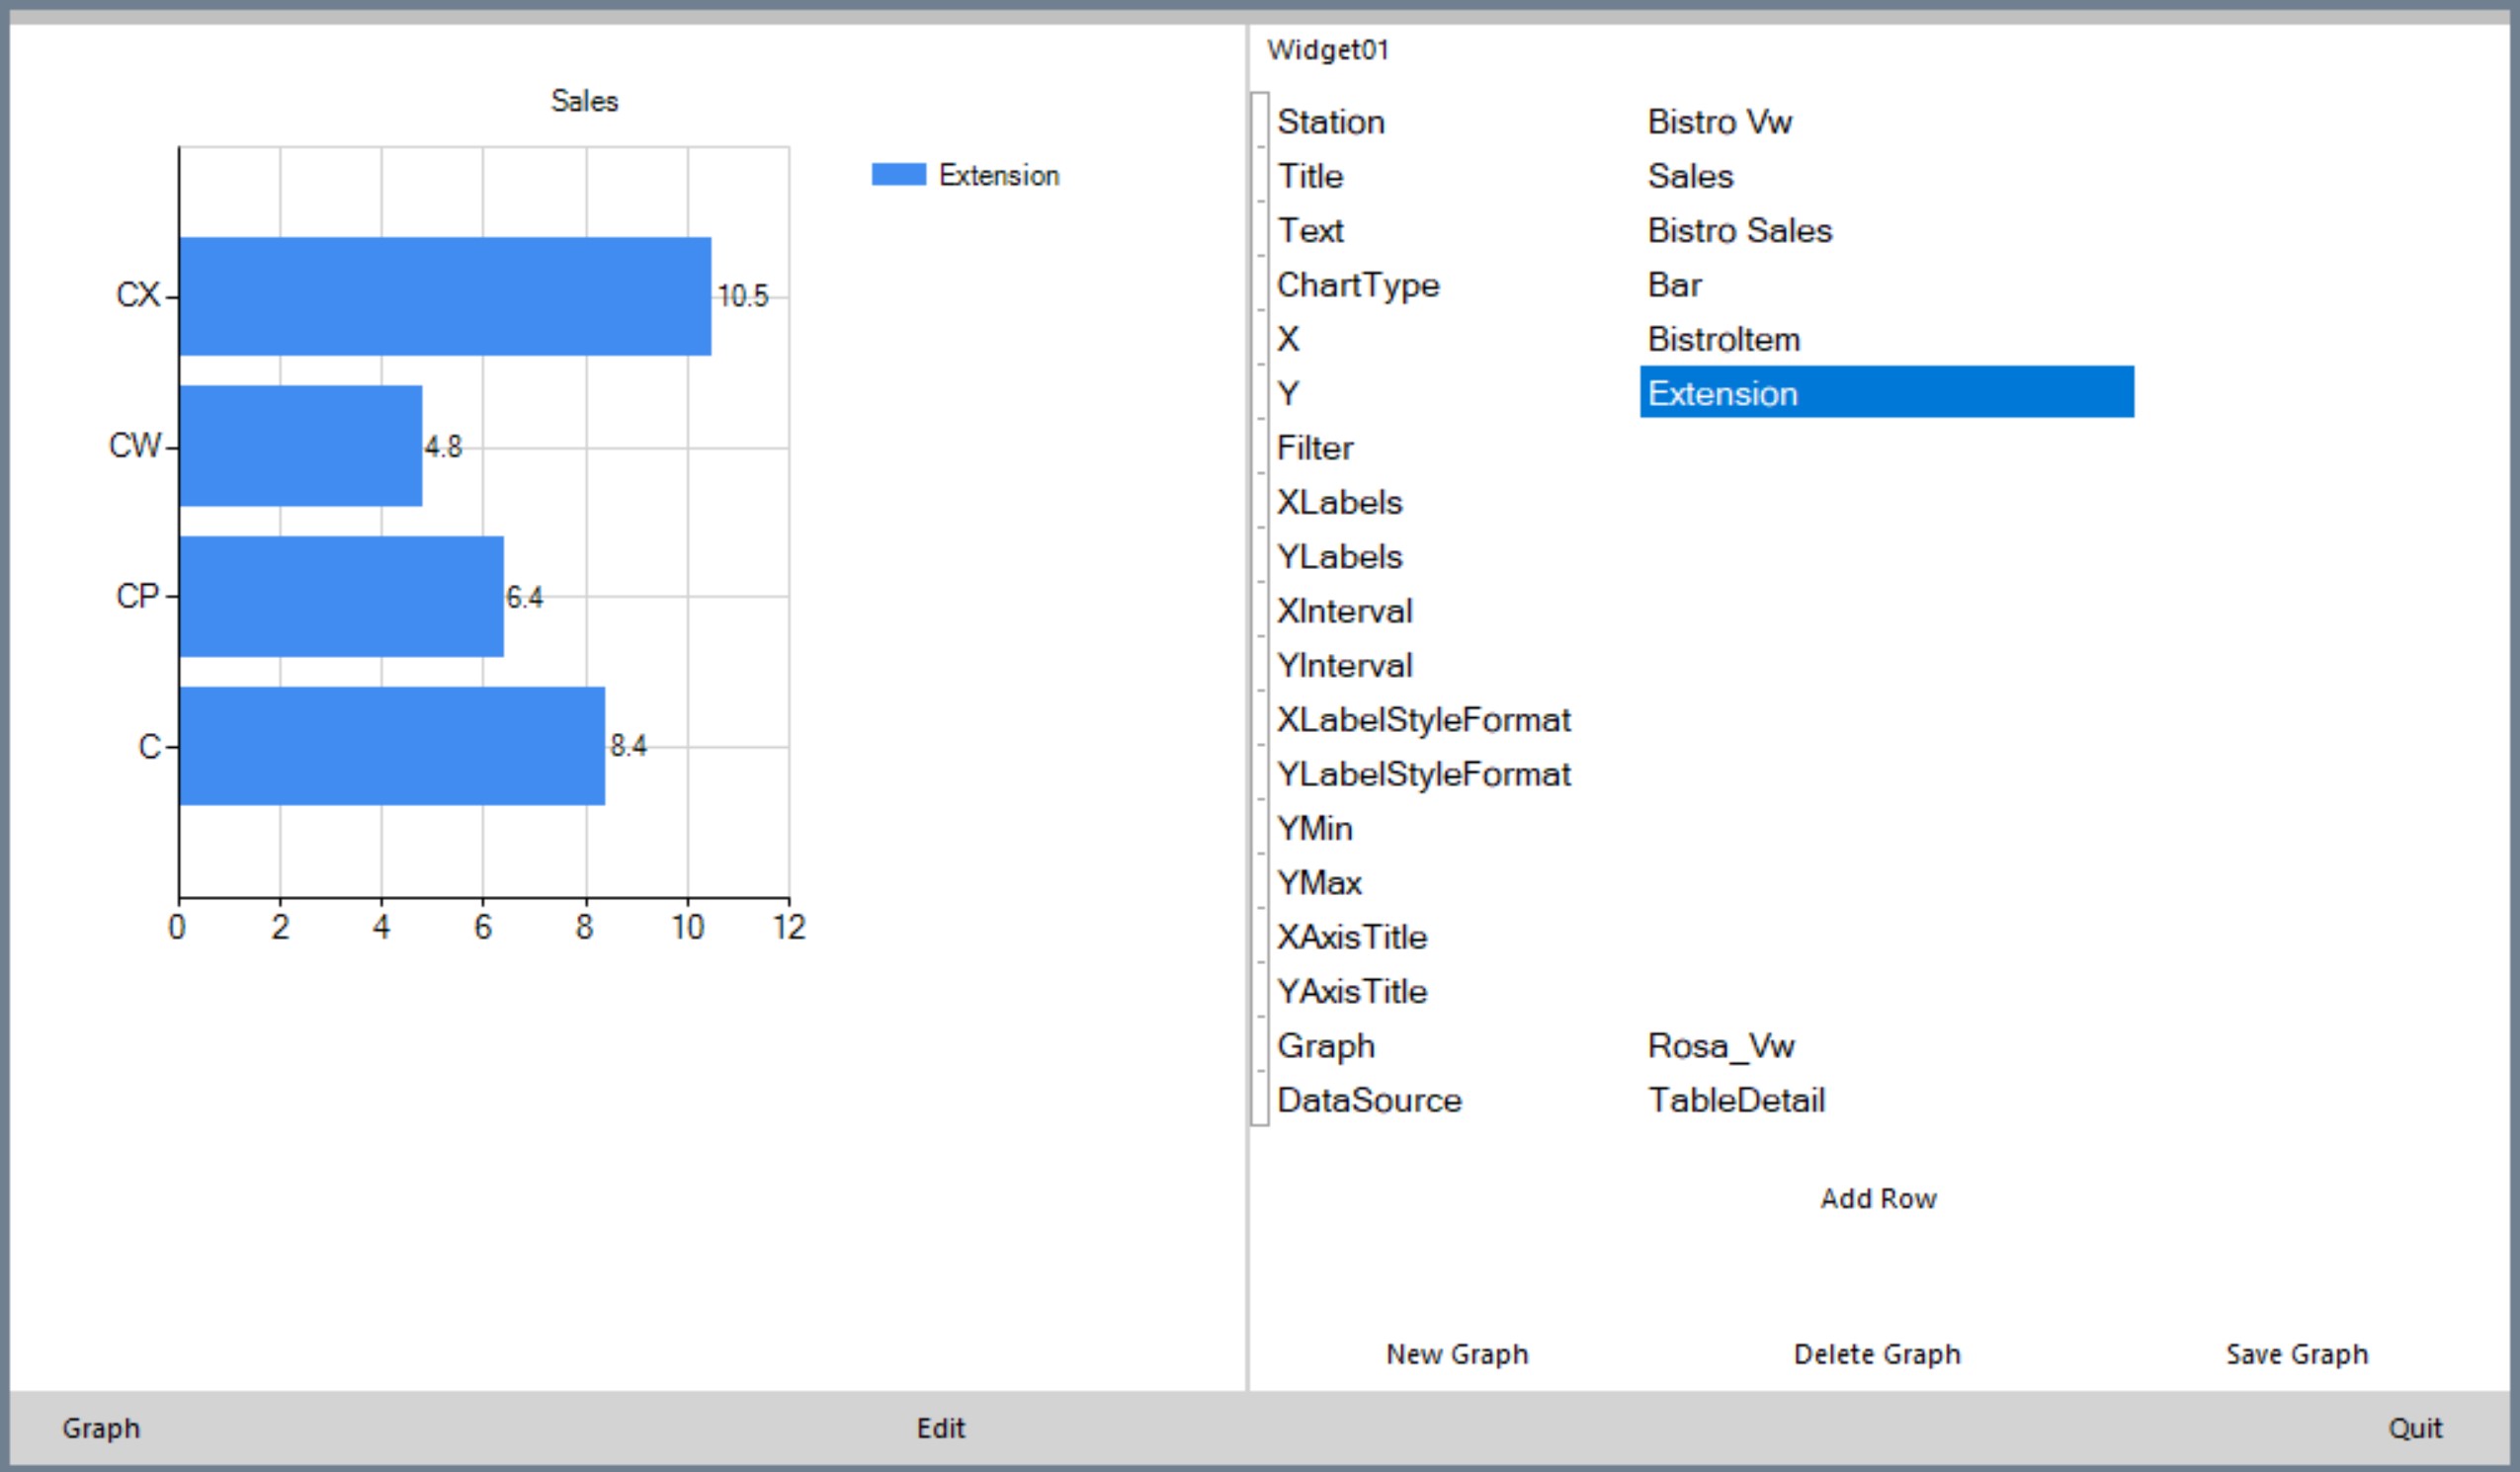
A report can have an unlimited number of graphs.
Sumer has a Dashboard window to gather important information in one place. Graphs can be added to the Dashboard with drag-and-drop.
